
From Tensors to Teraflops: A Mental Model for GPU Engineering for LLMs
I promised to share some material on GPU Engineering after my last talk on Fundamentals of GPU Orchestration at Luma.

Recently, there was a tweet that went viral on X-
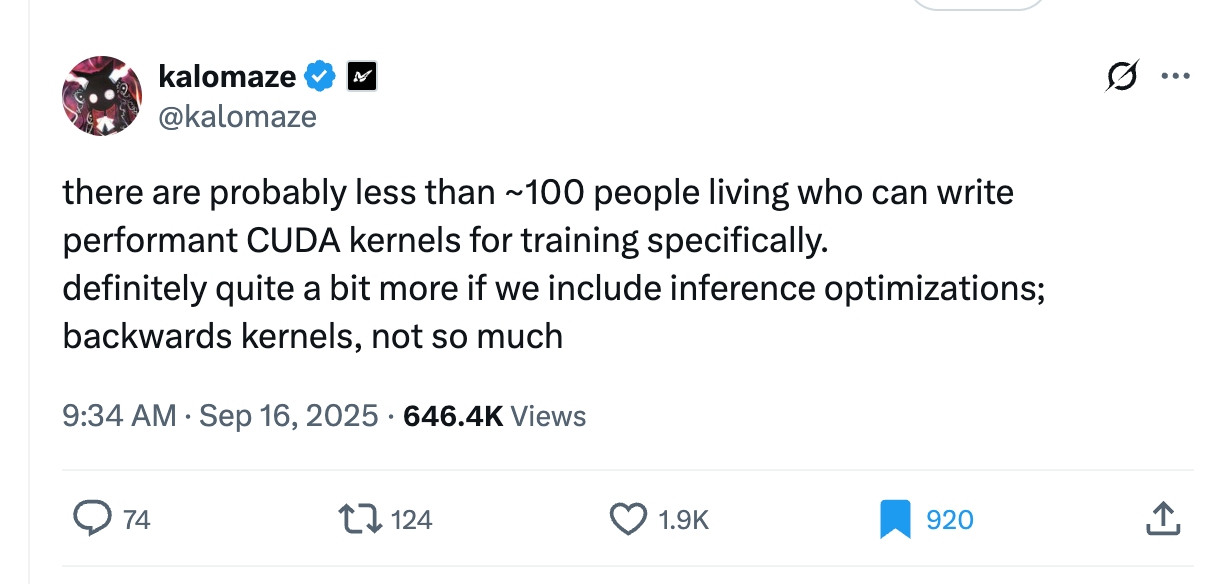
Most people read this and think: I need to learn CUDA kernel engineering to be valuable.
But that’s not true.
Even if you spent a lifetime on it, you’d probably never join that ~100-person club.
Kernels matter but not as your first step. What matters first is understanding how the whole system works
You could read hundreds of posts about Triton kernels, PCIe vs NVLink, or DeepSpeed ZeRO but as a GPU engineer, the real question isn’t Can I hand-write kernels? It’s How do all these pieces fit together? When do I care about each? Because the real gap in the industry isn’t lack of tooling skills. It’s lack of system design skills.
Very few people can truly look at a model as bytes flowing through hardware and tensors as layouts in memory. That’s what kernel engineers do. But to be in that rarefied group, first you need to understand how everything maps first.
Let me give you some of that system design understanding in this post today.
When your model spans dozens or hundreds of GPUs, you aren’t just asking - is my code correct? You’re asking - are my GPUs working together efficiently, or are they tripping over each other? The real bottlenecks are in synchronization, communication, scheduling, and utilization.
To see why, let’s step back and look at the system worflow that every model runs through (left to right):
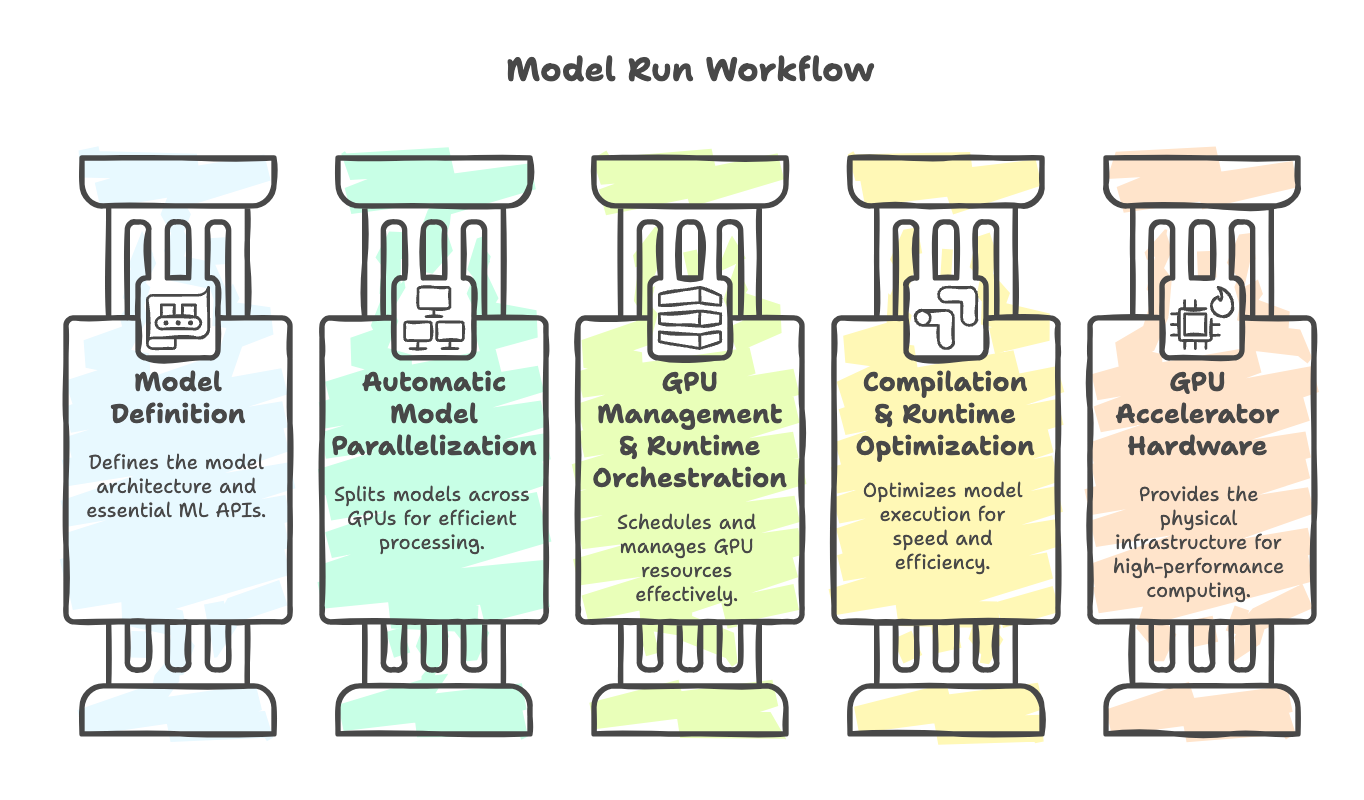
You always start at Model Definition. It’s faster, easier, and higher-leverage. Only if you can’t resolve the issue do you descend to the next steps.
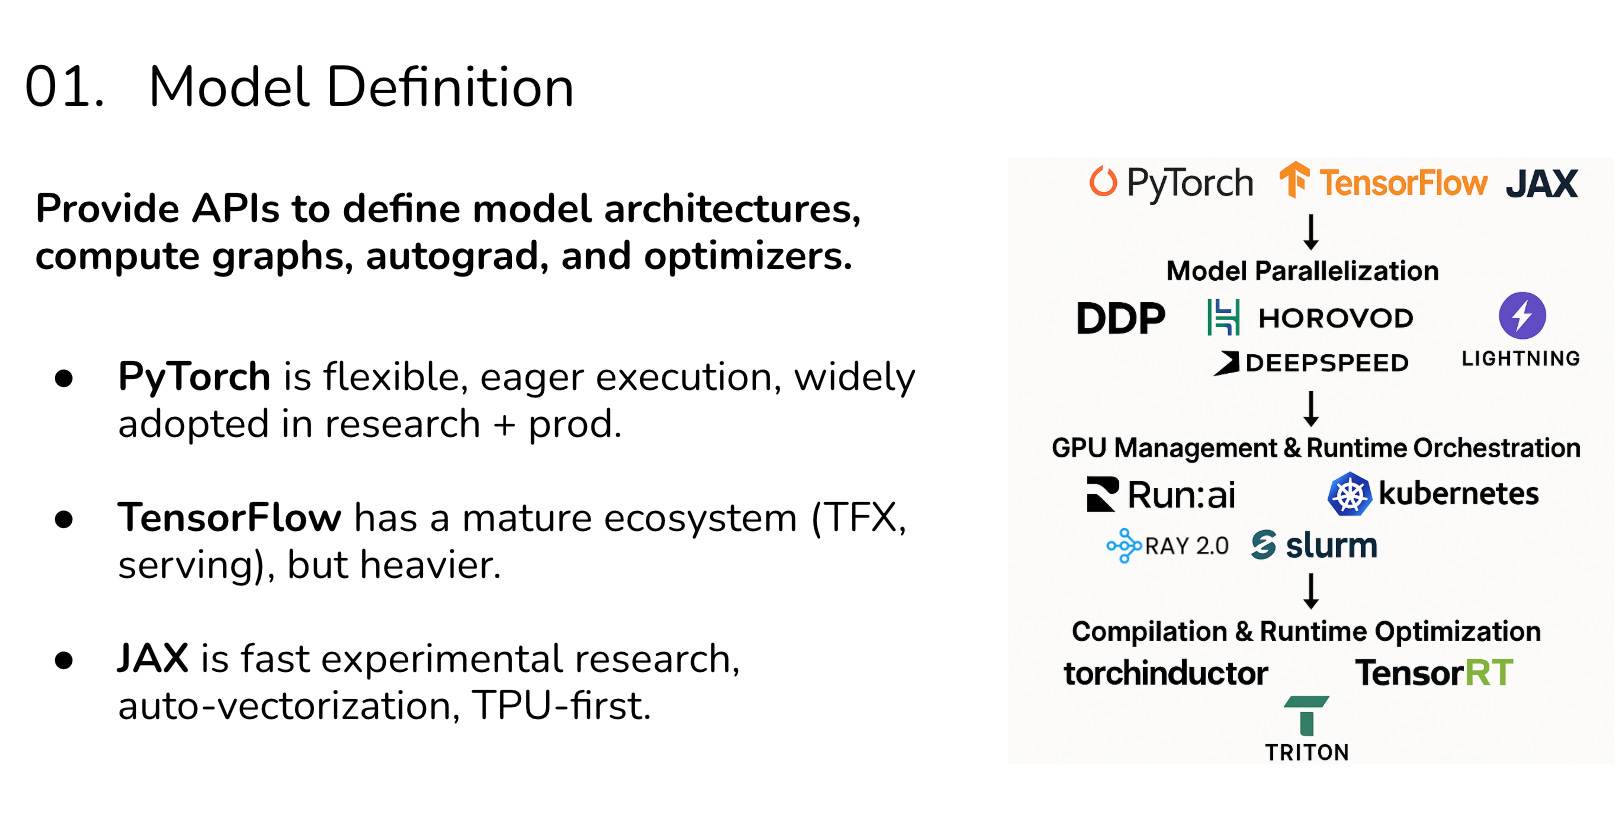
Layer 1: Model Definition
This is where most ML engineers start and spend most of their time: defining transformer layers, plugging them into PyTorch, relying on autograd and chaining together tensor ops.
When things go wrong here, it’s usually because:
Your dense matmuls are compute-bound, saturating the GPU ALUs.
Your attention layers are memory-bound waiting on bandwidth instead of math.
You’re launching too many small kernels causing overhead.
Debugging here means profiling with PyTorch or JAX tools and asking: “Is this a math problem, a memory problem, or a framework inefficiency?”
Now, lets take an example -
When your LLM explodes in size, it isn’t just compute that limited training speed but it is the memory bandwidth.
When GPT models grew huge, it was the memory bandwidth that slowed training. Each query-key-value multiplication created massive memory traffic. The fix? FlashAttention i.e. a fused kernel that reordered computation to reduce memory stalls. Without understanding the system, you wouldn’t know why GPUs were idle
Your job is to be able to run the model, try to optimize it and then you debug.
Learning the tools and framework for each layer gets you to that first 80%, and kernel engineering helps you squeeze that remaining 20% but aim to master only 20% without doing the first 80 and sorry, my statement will stand.
Even if you spent a lifetime on it, you’d probably never join that ~100-person club.
As you debug, you go through this chain of layers, figure below, looking into one after the other in a sequential manner.
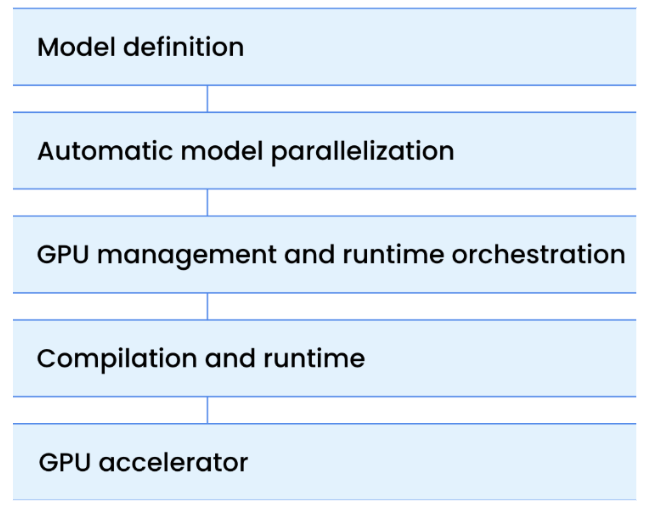
Think of GPU orchestration as a ladder. At each rung, you deal with a different layer of the stack. Each exposes distinct bottlenecks and failure modes. Mismanage one, and everything slows down. Start at the top, only descend when necessary.
Now, let’s look into the next which is -
Layer 2: Parallelization
Let’s say, one GPU isn’t enough for your LLM run, which is mostly the case so you scale out. This is where you step into parallelization. Here, the main challenge isn’t compute math, it’s synchronization. Gradients must flow across GPUs, parameters must be sharded, and optimizer states must be split.
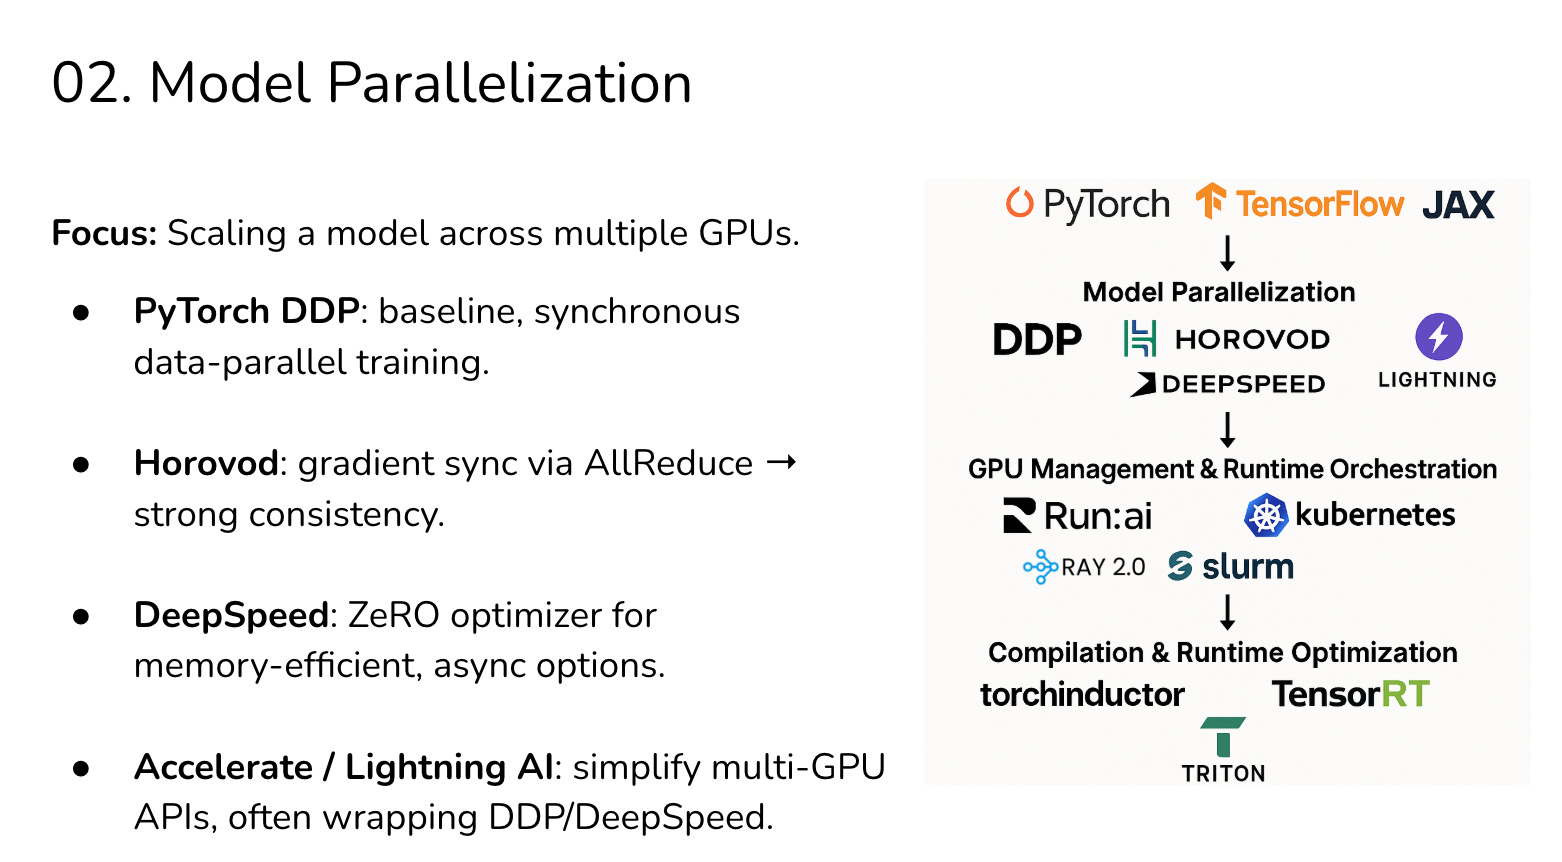
At this level, bottlenecks often come from:
Synchronous all-reduce kernels stalling on stragglers.
PCIe or NVLink bandwidth limits, or
Async updates improving throughput but risking stale gradients.
At this layer, your question changes from “Is my kernel efficient?” to “Are my GPUs exchanging information efficiently?” DeepSpeed ZeRO helps shard states and gradients, but introduces communication overhead.
Your bottleneck isn’t the GPU cores but it’s the network fabric. And the trade-off is strong synchronization (stable but slower) vs. relaxed async updates (faster but riskier).
If profiling shows that communication overlaps poorly with computation, you might use fused kernels or custom kernels to reduce computation overhead during transfers but this is rare and typically, DeepSpeed ZeRO or Megatron-LM already implement these optimizations.
Then you look into the next layer-
Layer 3: Runtime Orchestration
When you scale from one model training job to many, you enter orchestration. Now you’re no longer asking “is my attention kernel efficient?” instead you’re asking - why are 30% of my GPUs idle?
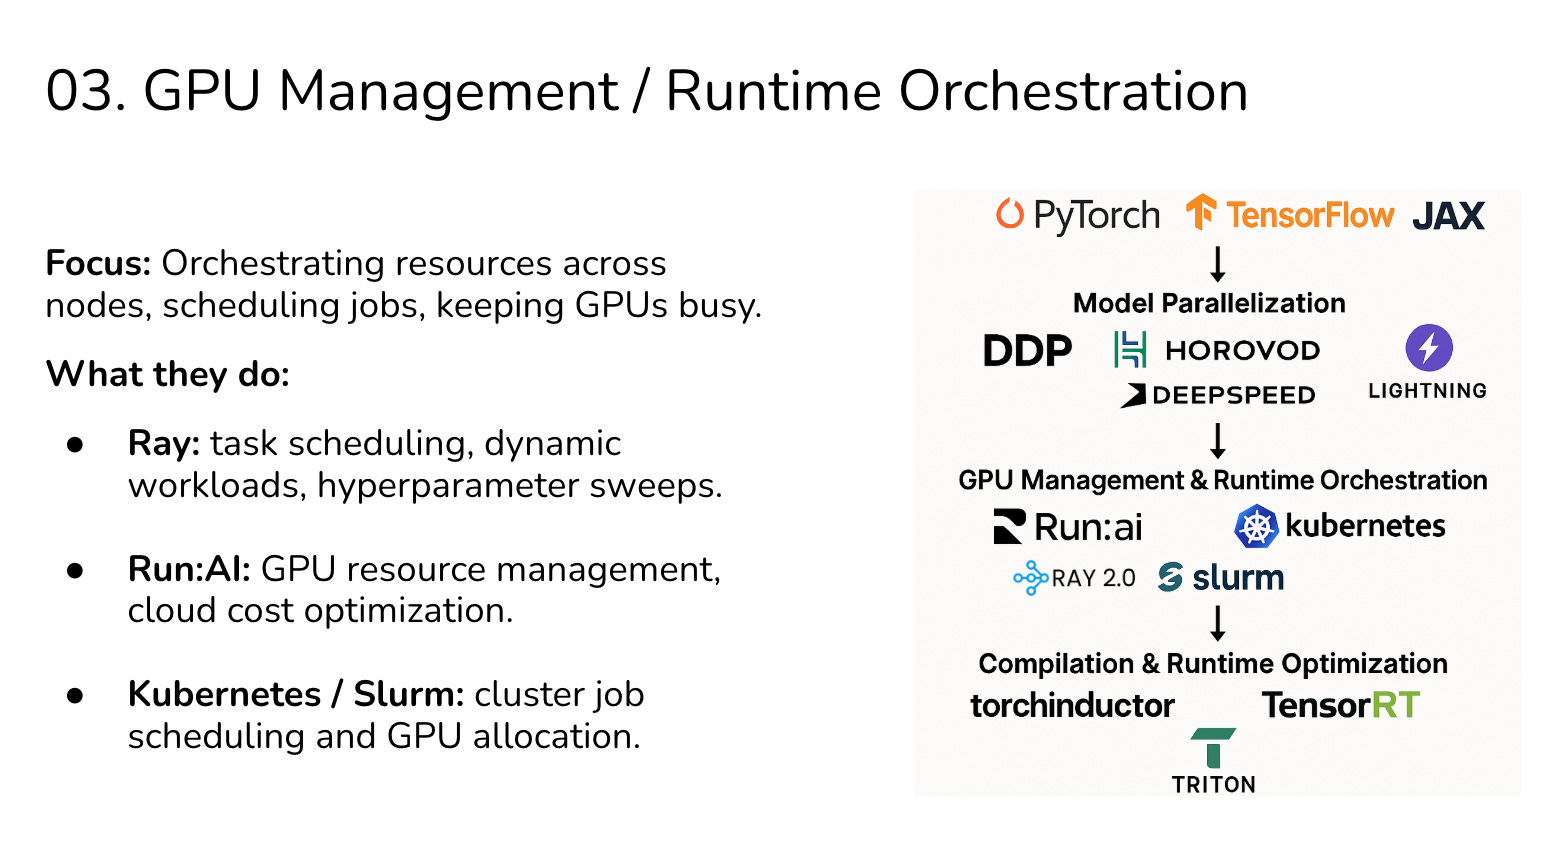
At this layer, problems often look like:
Half your GPUs are idle because one worker is lagging.
Jobs are stuck in queues because scheduling policies are unfair.
Cluster fragmentation because lots of small jobs leave resources stranded.
Debugging here means asking: “Am I orchestrating resources so that GPUs spend their time training, not waiting?”
Let’s look into an example, a case study we discussed about DeepMind in the talk
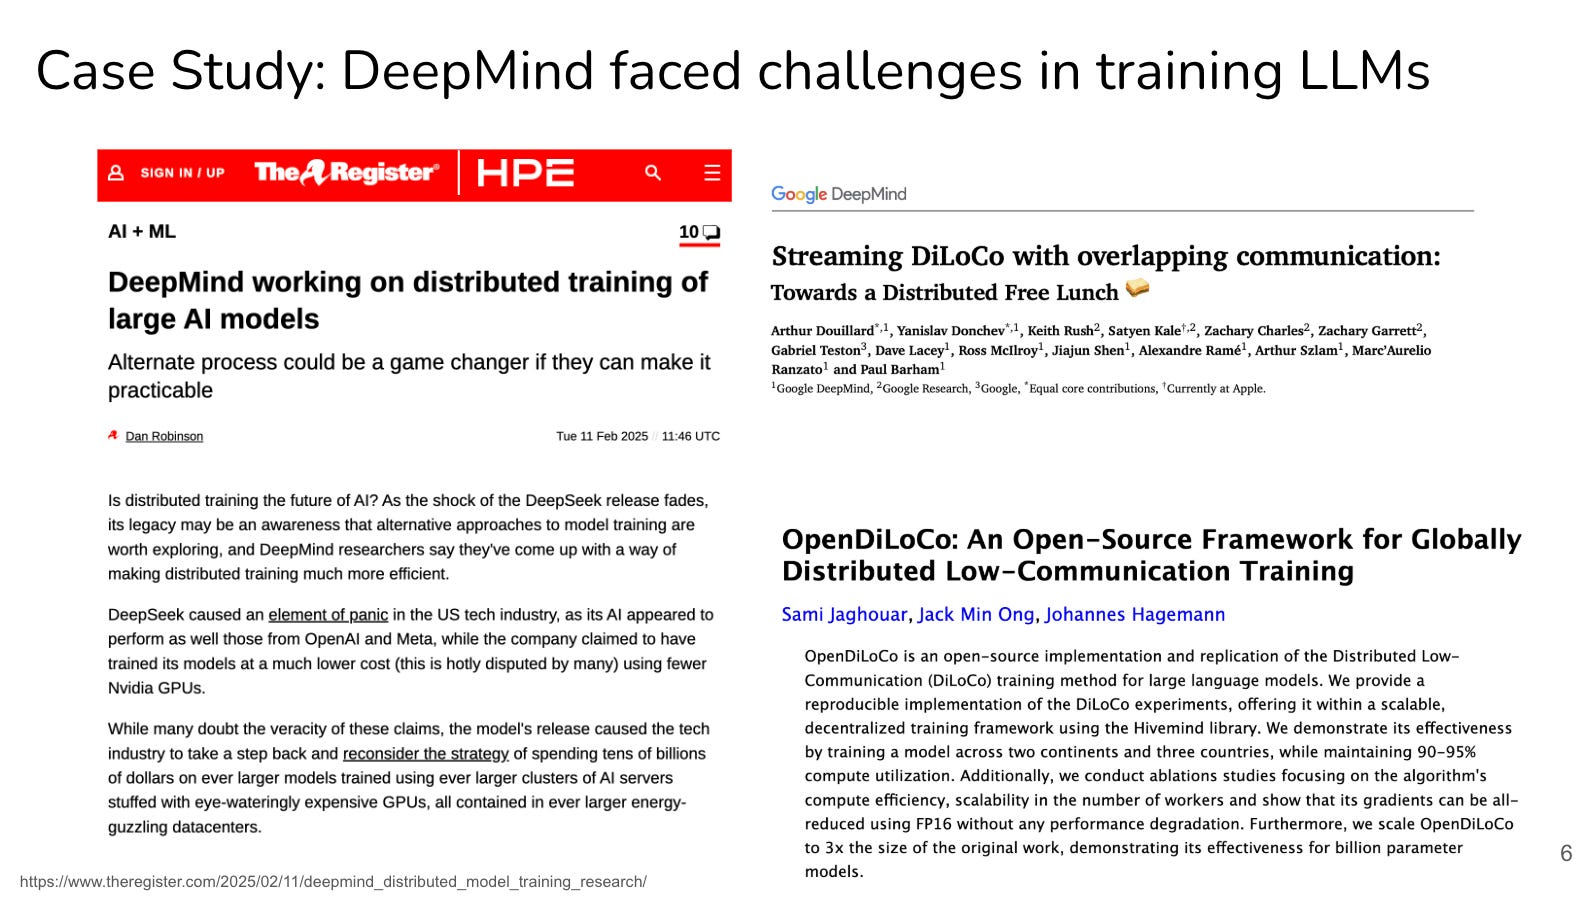
TLDR: DeepMind reported that even with thousands of GPUs, distributed training was stalling because a few slow nodes delayed global synchronization. In data-parallel training, the job waits for the slowest worker. Ray and Kubernetes help by managing elasticity (reassigning tasks when nodes fail) and scheduling (ensuring GPUs aren’t stranded in queues).
But orchestration can’t magically solve poor synchronization logic, you need both orchestration and parallelization tuned.
Once you have already implemented that, you could write fused kernels. Or, optimize collective communication kernels (like custom all-reduce implementations) to slightly reduce the time each GPU spends in compute while waiting on communication. Or, you could pre-fetch tensors or align them for DMA transfers. Or, you could implement custom scheduling-aware kernels that better exploit GPU pipelines while orchestrators like Ray/Kubernetes schedule jobs.
But again, kernel engineering is for edge cases only and depends on the kind of issue in debugging.
Layer 4: Compilation & Optimization
After training, LLMs need to serve millions of requests and you care about latency and throughput in production. At this point, every millisecond counts. Compilers solve these by fusing kernels, optimizing memory locality, and lowering precision.
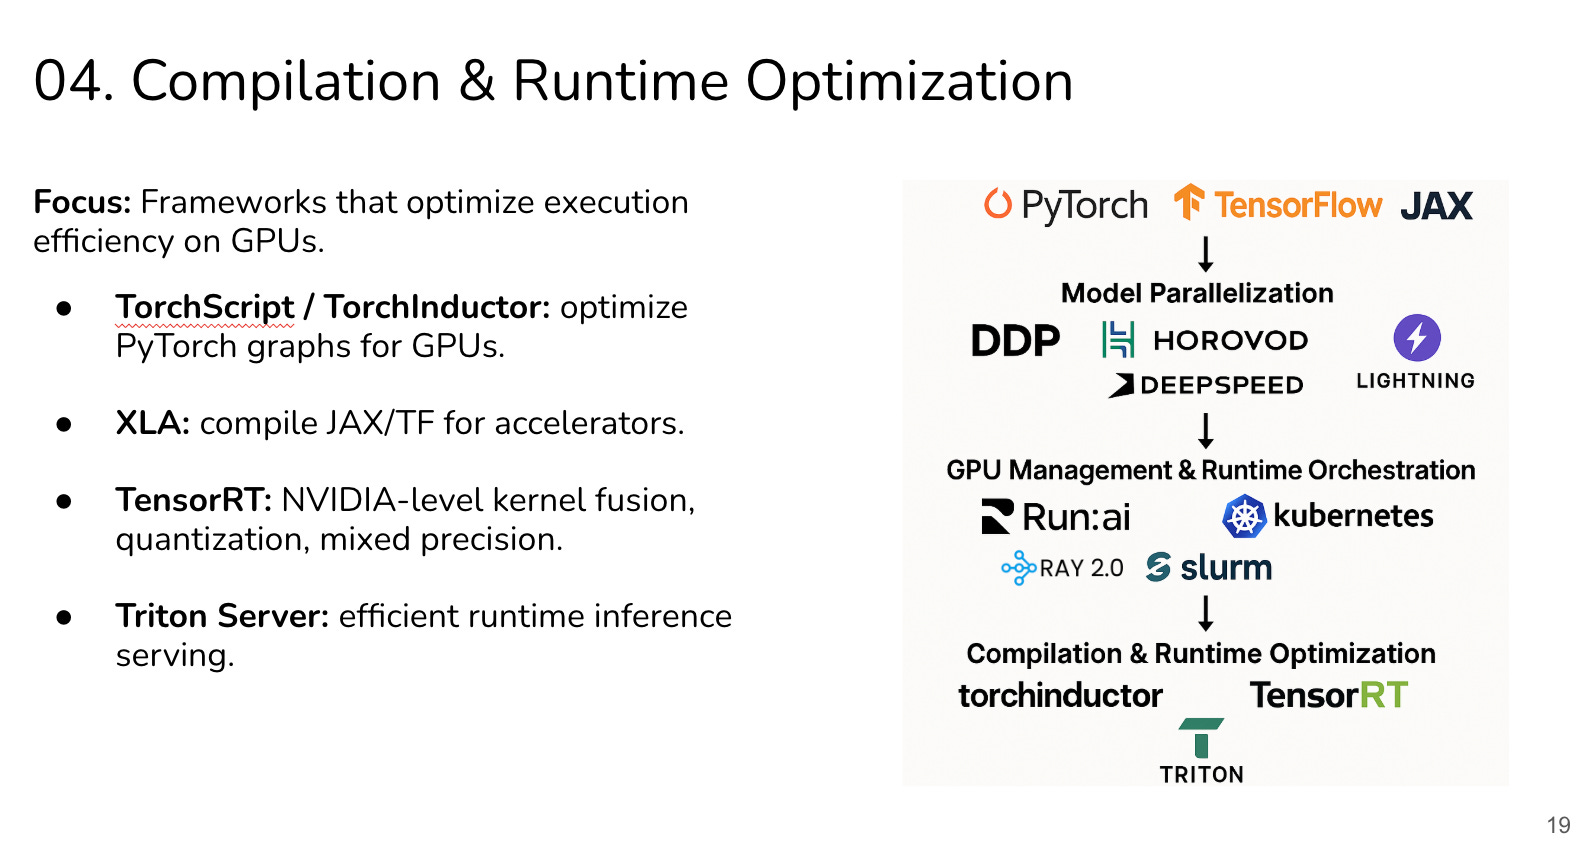
So, here the main challenges are:
Too many kernel launches for small ops.
Memory traffic dominating runtime (e.g., embedding lookups).
Lack of fusion or quantization leaving performance on the table.
Here, the bottleneck isn’t training speed, it’s throughput and latency under real-world traffic. Debugging here is about profiling inference workloads and asking: “Am I getting the maximum throughput per GPU dollar?”
For eg. let’s say you are inferencing ChatGPT. Inference with ChatGPT often involves many small operations aka token-by-token generation. If each operation launches a separate kernel, kernel launch overhead dominates.
Compilers like TorchInductor fuse operations into larger kernels, and TensorRT quantizes models to FP16 or INT8 to save both compute and memory. Triton Server then orchestrates batching, so GPUs handle thousands of requests efficiently.
This is where kernel engineering matters. Unlike Layer 1–3, this is the stage where hand-tuning or compiler-level interventions meaningfully affect latency and throughput. But, you generally only transition to writing custom kernels after you’ve exhausted what the above compilers can do. Custom kernels make sense for operations that run millions or billions of times per inference/training step.
So, the key lesson here is -
Layers 1–3: Focus on system design, orchestration, and parallelization. Kernel writing is mostly irrelevant here.
Layer 4: Use compilers, batching, quantization, and fusion. Most real-world bottlenecks can be solved here.
and custom kernels only come into play when profiling proves that even these optimizations aren’t enough, and you have some very high leverage operations worth hand-tuning.
Layer 5: Hardware Layer
This is the bedrock. Every kernel, every synchronization, every shard eventually hits the physical limits of your GPUs and interconnects.
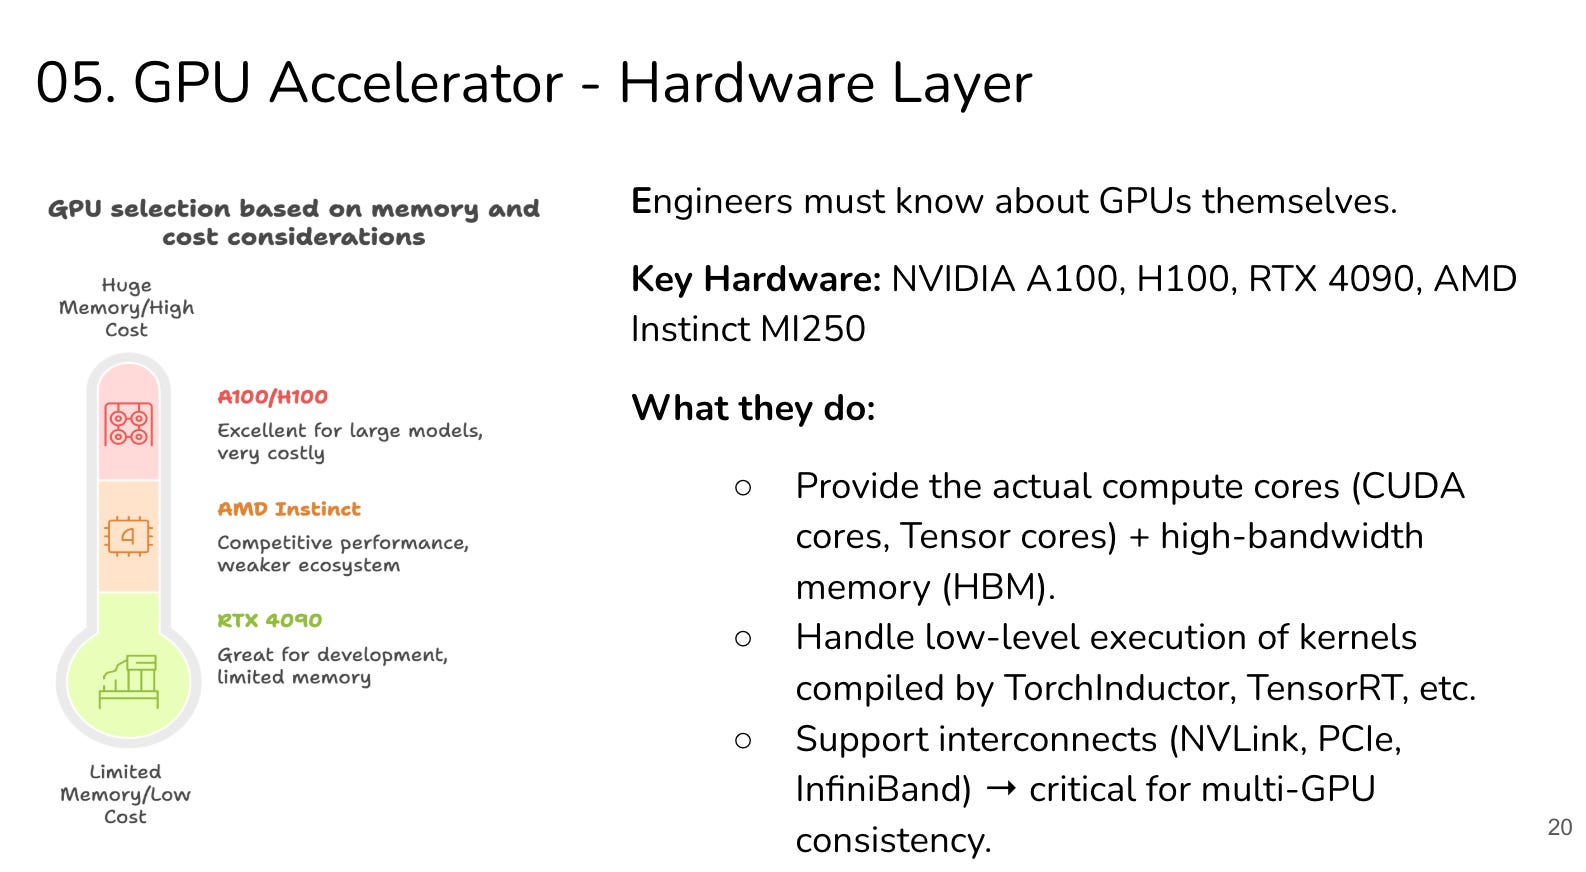
Here, bottlenecks manifest as:
NVLink bandwidth saturation in model parallelism.
PCIe chokepoints when scaling across nodes.
Memory ceilings on GPU cards forcing offload to NVMe.
You can’t “fix” these with frameworks. You work around them by restructuring workloads, changing precision, or upgrading hardware.
Large-scale training often saturates InfiniBand links when gradients are synced across thousands of GPUs. You can’t “code around” this. PCIe and NVLink have finite bandwidth. This is where AI engineering blends into hardware engineering.
The only solutions are architectural: use better interconnects, reduce synchronization frequency, or redesign algorithms to communicate less.
This is where the other case study, we talked about comes-
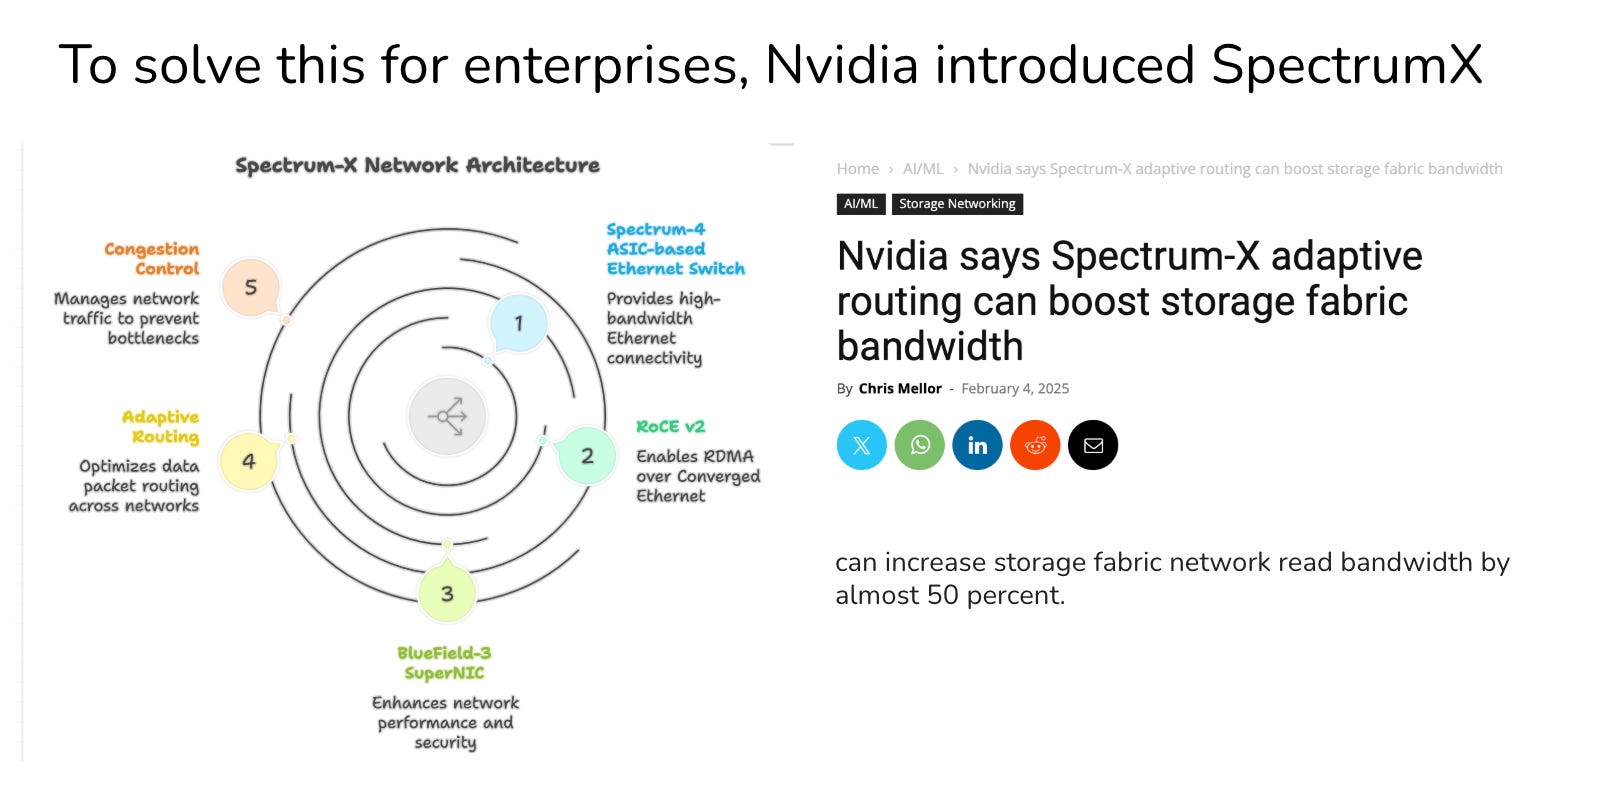
Spectrum X can profile GPU memory usage, interconnect bandwidth (NVLink, PCIe, InfiniBand), and kernel execution to show exactly where bottlenecks occur.
The Key Lesson
Each layer is modular but interdependent:
If you mismanage memory in Model Definition, you create communication bottlenecks in Parallelization.
If you misconfigure synchronization in Parallelization, you leave GPUs idle in Runtime Orchestration.
If you ignore kernel fusion in Compilation, you burn money on latency in production.
Thus, if the model is
Compute-bound → Fix with model/kernel optimizations.
Memory-bound → Solve with sharding, recomputation, kernel fusion.
Communication-bound → Tackle with parallelization and orchestration.
Once you carry this map, all the scattered blog posts, papers, and debates stop being noise. They snap into place as parts of a bigger system.
PS: I still haven’t released the Maven course I mentioned on the last newsletter. I am finishing up the final material prep for the same. But I will announce the next GPU Engineering Meetup talk here, if you want to attend. And feel free to follow me on socials @goabiaryan (Linkedin, Twitter etc) for more regular updates.